sanitisers-guide
heap-buffer-overflow
A heap-buffer-overflow occurs when you attempt to access memory outside what has been allocated on the heap. Memory allocated via functions like malloc() and calloc() are allocated on the ‘heap’ section of memory.
Common causes include accessing an index out of bounds of a dynamically allocated array, or allocating insufficient memory.
Reading the error message
This is a typical heap-buffer-overflow message:
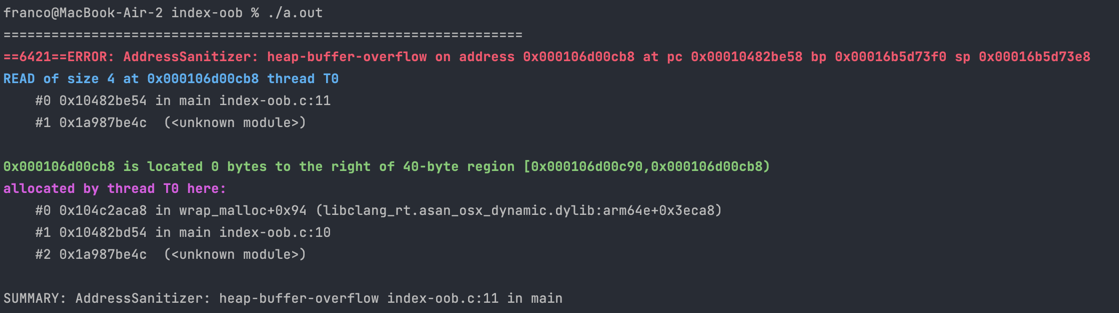
Here is the useful information you can get from this error message:
Access Type
The blue line starts with READ/WRITE of size N.
Firstly, this tells us whether the error occurred due to reading from or writing to an invalid address. If you have a line like dest[i] = src[i] with both reading and writing, this can tell you whether the error is with reading from src or writing to dest.
This also gives some hints to the type of the memory you tried to access. For example if N=4 then we might be trying to access an integer which is 4 bytes.
Error Location
The first stack trace describes where (which line/function/file) the error occurred. See here for a guide on reading stack traces.
Incorrectly Accessed Memory Details
Most of the time, the sanitiser can also determine what memory you were trying to access when the error occurred.
Relative Location of Access
The green line says located X bytes to the left/right of N-byte region.
The left/right tells you whether you are accessing before the start/after the end of the allocated memory. To the left usually means you are using a negative index to an array, and to the right means you are using an index that is too high.
The size of the allocated memory (N) can give you a hint if you’ve allocated insufficient memory. For example, if you’ve meant to allocate memory for a struct but there’s only an 8-byte region allocated, you may have only allocated enough memory for the pointer.
The number of bytes left/right (X) can sometimes be helpful to quickly tell you what index you’ve used. For example, if it’s 0 to the right and your array is size 10 then you’ve used index 10, which is just past the end of the array.
Allocation Location
The second stack trace below the green line describes where (which line/function/file) the incorrectly accessed memory was initially allocated. See here for a guide on reading stack traces.
This might be useful if you want to double-check the line where you allocated the memory to make sure you’re allocating sufficient memory.